
Indicator analysis. Daily review on GBP / USD for May 5, 2020
Relevance up to 23:00 2020-05-05 UTC--7
Trend analysis (Fig. 1).
Today, an upward pullback is possible from the level of 1.2443 (closing of yesterday's candle) with the target at 1.2496 - a 61.8% pullback level (presented in a red dotted line). In case of breaking this level upwards, the next target will be at 1.2555 - a 75.4% retracement level (presented in a red dashed line).
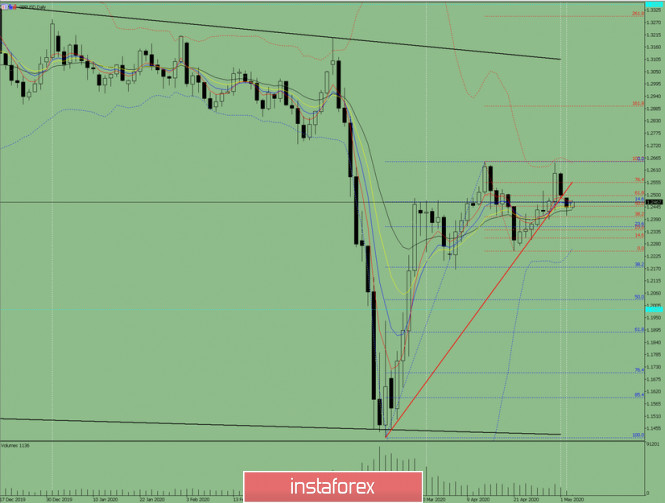
Fig. 1 (daily chart).
Comprehensive analysis:
- Indicator analysis - down;
- Fibonacci levels - up;
- Volumes - up;
- Candlestick analysis - down;
- Trend analysis - up;
- Bollinger Lines - up;
- Weekly schedule - up.
General conclusion:
Today, the price may move upwards with the target of 1.2496 - a 61.8% retracement level (presented in a red dotted line). In case of breaking this level upwards, the next target will be at 1.2555 - a 75.4% retracement level (presented in a red dashed line).
Another possible but unlikely scenario is a bullish trend from the level of 1.2496 - a 61.8% retracement level (presented in a red dashed line) with a target at 1.2357 - a 23.6% retracement level (presented in a blue dashed line). If this level is broken downwards, the price may continue to move downwards with the target of 1.2176 - a 38.2% retracement level (presented in a blue dashed line).
*The market analysis posted here is meant to increase your awareness, but not to give instructions to make a trade.

Performed by Stefan Doll,
Analytical expert
InstaForex Group © 2007-2020
Benefit from analysts’ recommendations right now
Top up trading account
Get a bonus from InstaForex
InstaForex analytical reviews will make you fully aware of market trends! Being an InstaForex client, you are provided with a large number of free services for efficient trading.

Read More


No comments